Maps
POI markers, data points, and country highlights
Maps (POI Markers)
generate_mapGenerate map images with point-of-interest markers. Supports multiple tile styles (OpenStreetMap, satellite, Carto, topographic), custom marker colors, and built-in social media presets for TikTok, Instagram, X/Twitter, Facebook, and YouTube.
Preview
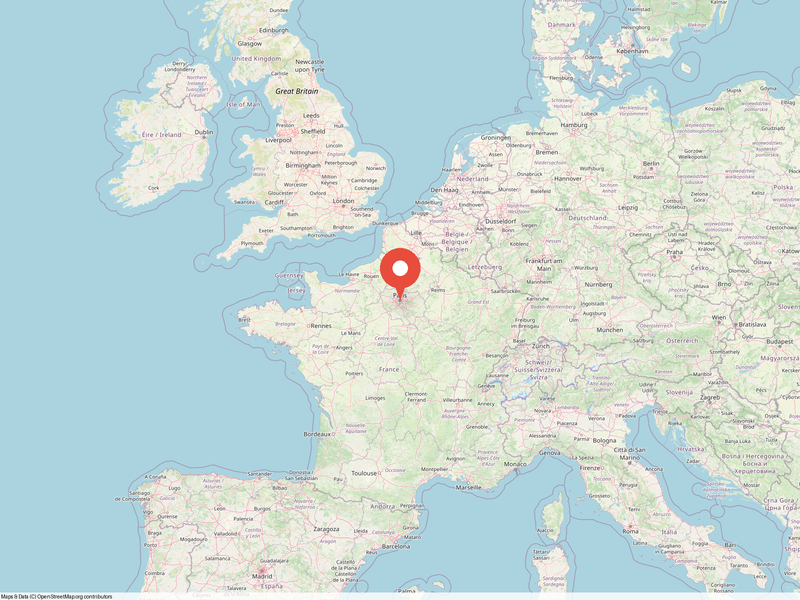 Paris - OSM style
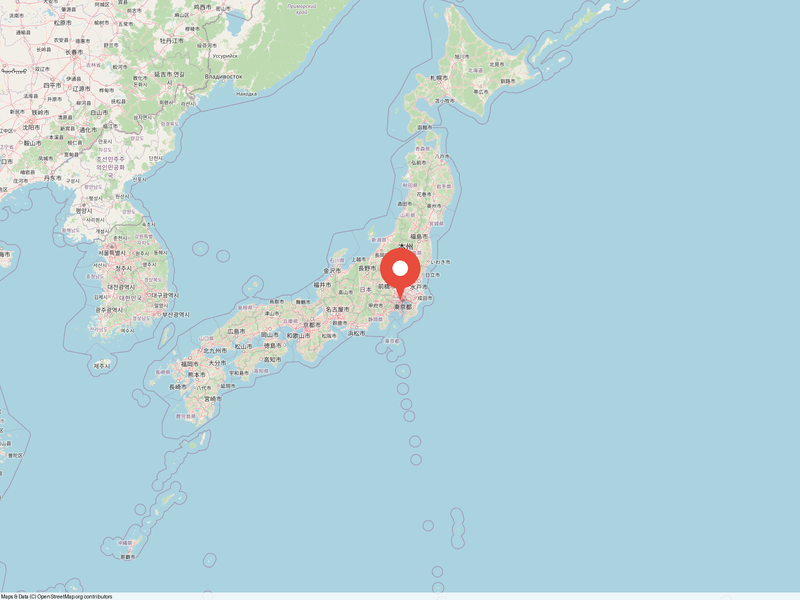 Tokyo - OSM style
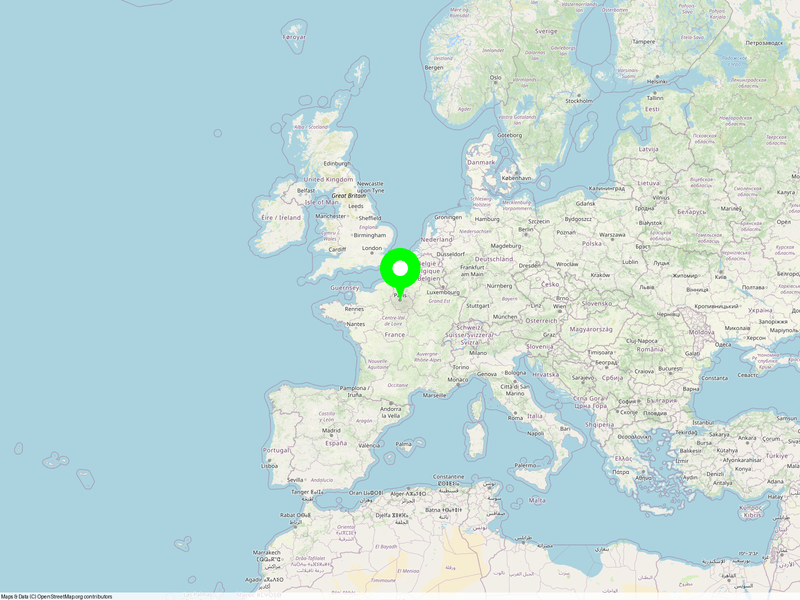 Custom green markers
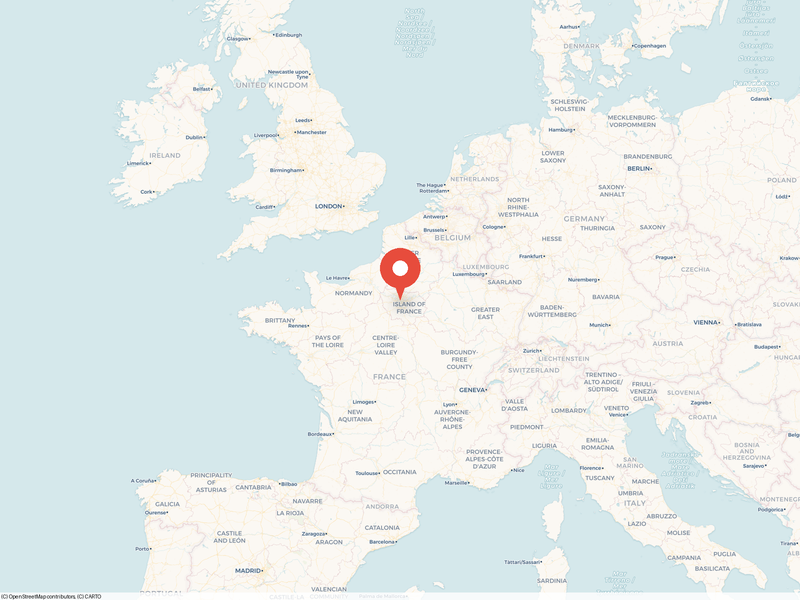 Carto light style
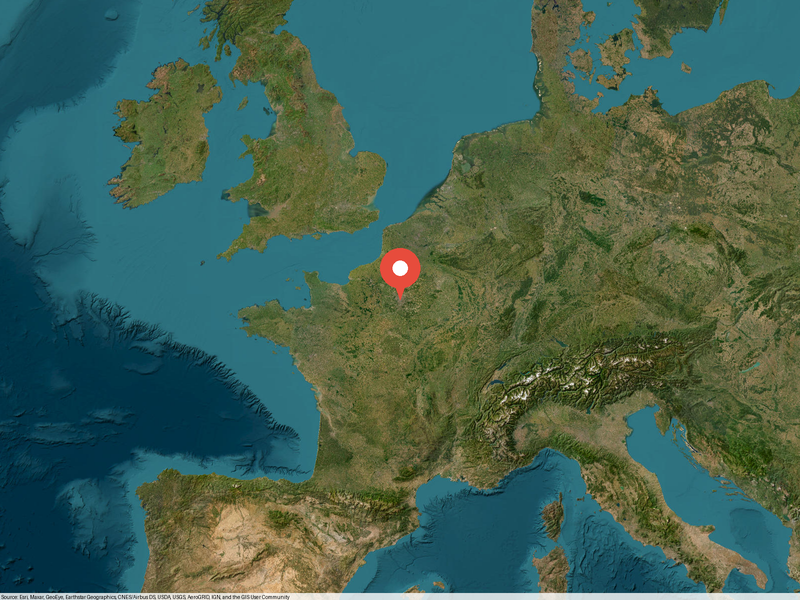 Satellite imagery
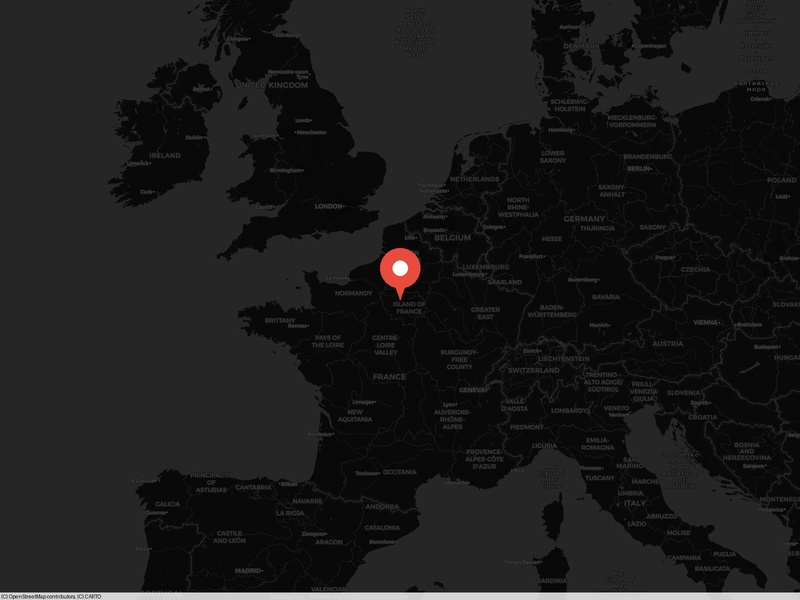 Carto dark style
Parameters
| Name | Type | Description | Default |
|---|---|---|---|
latitude | number | Map center latitude | 48.8566 |
longitude | number | Map center longitude | 2.3522 |
zoom | integer | Zoom level (1=world, 18=street) | 12 |
markersrequired | array | POI markers with lat, lng, color, and label | - |
width | integer | Image width in pixels | 800 |
height | integer | Image height in pixels | 600 |
style | string | Tile style: osm, satellite, carto, carto-dark, topo | osm |
preset | string | Social media preset (overrides width/height) | - |
Example Prompts
“Create a map of Paris showing the Eiffel Tower, Louvre, and Notre-Dame”
“Generate a satellite map of Tokyo with markers at major train stations”
“Show me a dark-themed map of London with custom green markers at popular attractions”
Map Points (Round Dots)
generate_map_pointsPlot round colored dots on a map. Each point has latitude, longitude, color, and customizable size. Renders on tile-based maps with anti-aliased circles using 2x supersampling. Great for showing locations, data density, or geographic distributions.
Preview
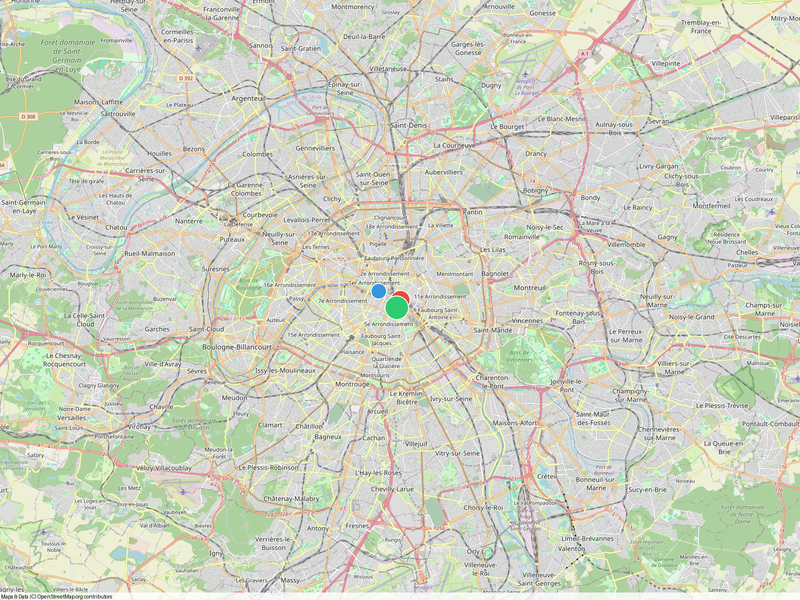 Points on Paris map
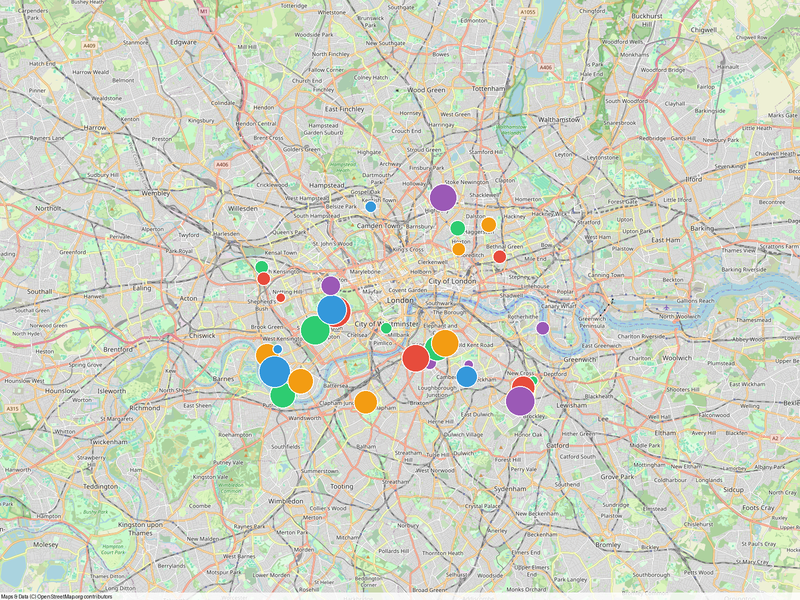 Multiple points in London
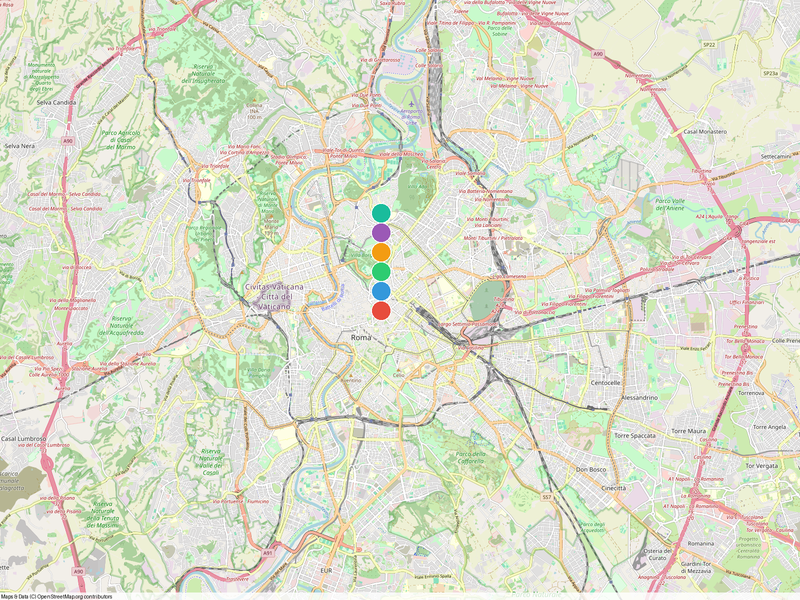 Multi-color points in Rome
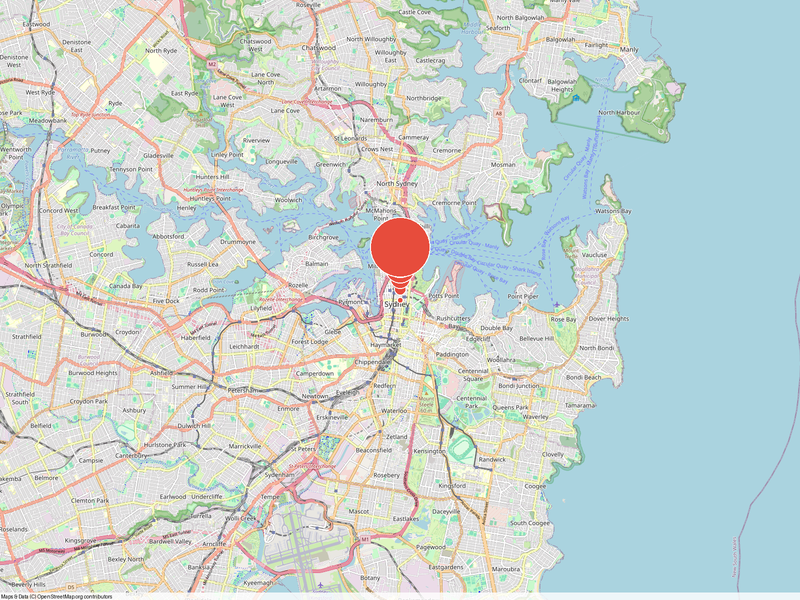 Variable dot sizes
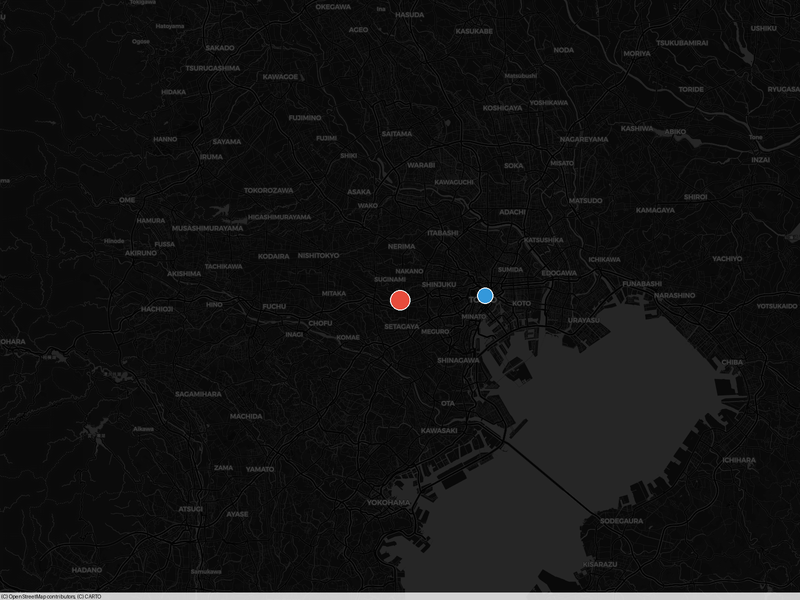 Carto dark style
Parameters
| Name | Type | Description | Default |
|---|---|---|---|
latitude | number | Map center latitude | 48.8566 |
longitude | number | Map center longitude | 2.3522 |
zoom | integer | Zoom level (1=world, 18=street) | 5 |
pointsrequired | array | Points with lat, lng, color (#hex), and size (2-50px) | - |
width | integer | Image width in pixels | 800 |
height | integer | Image height in pixels | 600 |
style | string | Tile style: osm, satellite, carto, carto-dark, topo | osm |
preset | string | Social media preset (overrides width/height) | - |
Example Prompts
“Plot red dots at all European capital cities on a map”
“Show office locations as blue dots on a world map”
“Create a map with different-sized dots showing population by city”
Map Points (PowerPoint)
generate_map_points_pptxGenerate an editable PowerPoint slide with map points as native shapes. The ocean is a rectangle, land masses are freeform polygons, and dots are oval shapes. Everything is fully editable in PowerPoint — recolor, resize, or rearrange any element.
PPTX output uses native vector shapes — no raster images. Every element is individually selectable and editable.
Preview
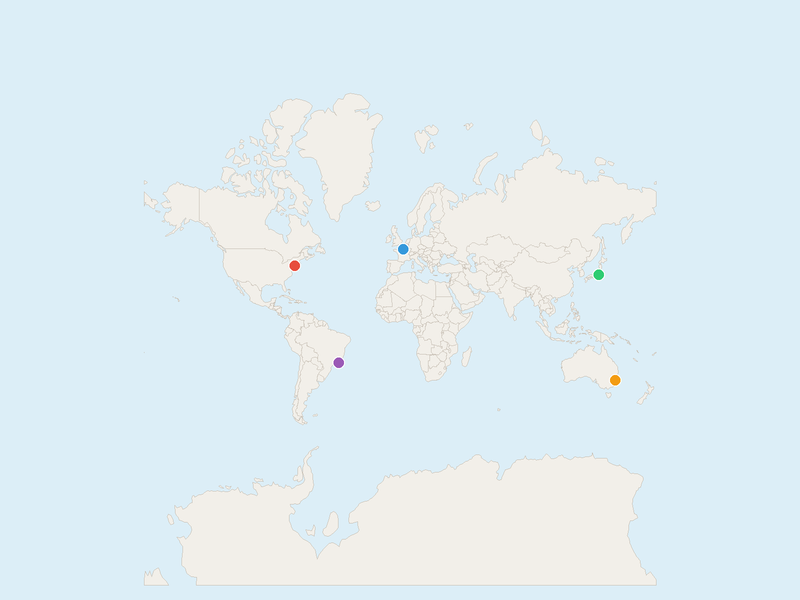 World overview with dots
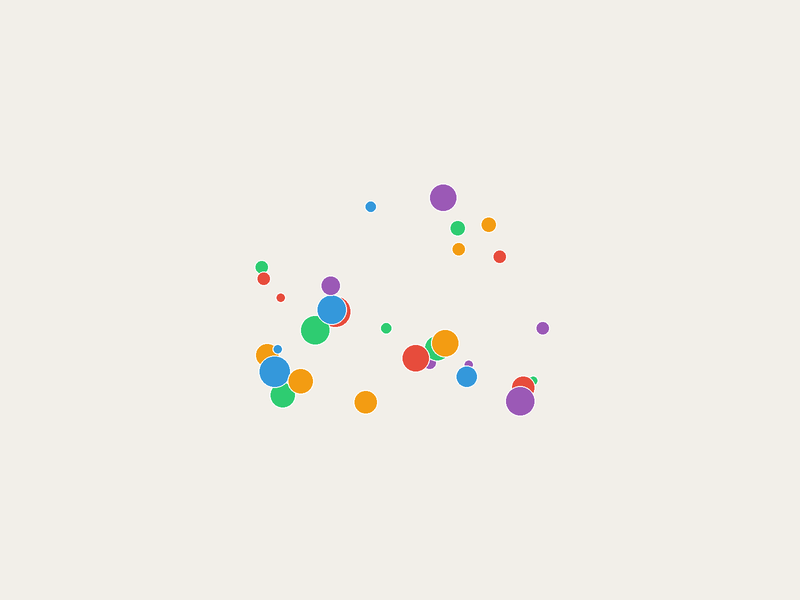 Europe zoom with dots
Parameters
| Name | Type | Description | Default |
|---|---|---|---|
latitude | number | Map center latitude | 20.0 |
longitude | number | Map center longitude | 0.0 |
zoom | number | Zoom level | 2.0 |
pointsrequired | array | Points with lat, lng, color (#hex), and size (2-50px) | - |
style | string | Color theme: osm, satellite, carto, carto-dark, topo | osm |
Example Prompts
“Create an editable PowerPoint map with dots at our warehouse locations”
“Generate a PPTX world map showing customer distribution as colored dots”
Map Countries (Highlight)
generate_map_countriesHighlight selected countries on a map with custom fill colors. Countries can be specified by ISO 3166-1 alpha-2 code (US, FR), alpha-3 code (USA, FRA), or full name. Non-highlighted countries appear in the default land color. Ideal for choropleth-style maps, regional analysis, or geographic comparisons.
Preview
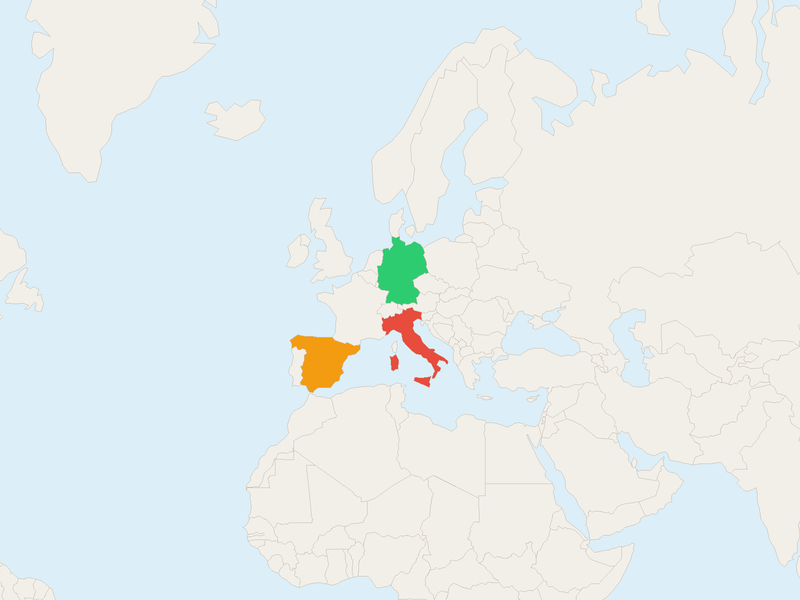 EU countries highlighted
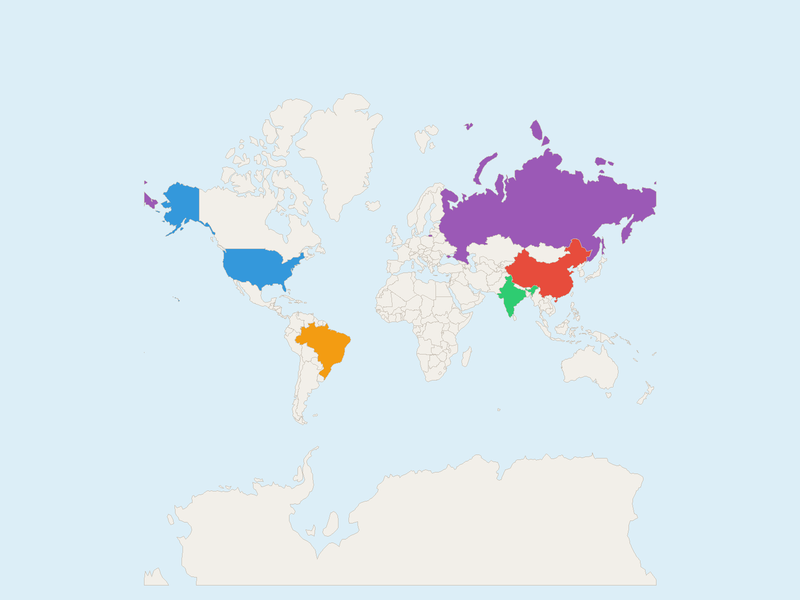 BRICS nations on world map
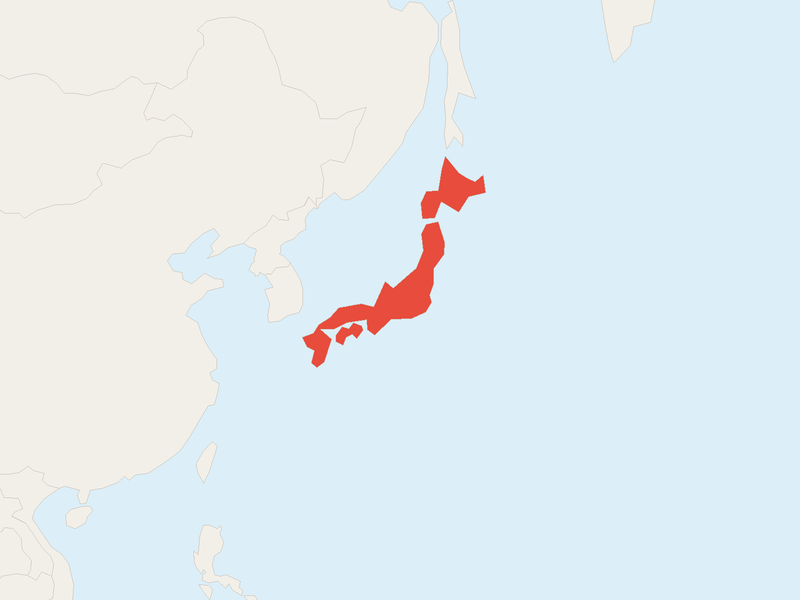 Single country: Japan
 France - Carto dark style
Parameters
| Name | Type | Description | Default |
|---|---|---|---|
latitude | number | Map center latitude | 20.0 |
longitude | number | Map center longitude | 0.0 |
zoom | integer | Zoom level (1=world, 18=street) | 2 |
countriesrequired | array | Countries to highlight: {country, color} | - |
width | integer | Image width in pixels (PNG only) | 800 |
height | integer | Image height in pixels (PNG only) | 600 |
style | string | Tile style: osm, satellite, carto, carto-dark, topo | osm |
preset | string | Social media preset (PNG only) | - |
Example Prompts
“Highlight all EU member states in blue on a map of Europe”
“Show BRICS countries in different colors on a world map”
“Create a map highlighting countries where we have offices in green and partners in yellow”
Map Countries (PowerPoint)
generate_map_countries_pptxGenerate an editable PowerPoint slide with country polygons as native freeform shapes. Highlighted countries get custom fill colors. Every country is individually selectable, recolorable, and editable in PowerPoint.
Each country is a native freeform shape. Select any country in PowerPoint to change its color, add text, or adjust borders.
Preview
Countries as editable shapesWorld map with BRICS highlightedParameters
| Name | Type | Description | Default |
|---|---|---|---|
latitude | number | Map center latitude | 20.0 |
longitude | number | Map center longitude | 0.0 |
zoom | integer | Zoom level (1=world, 18=street) | 2 |
countriesrequired | array | Countries to highlight: {country, color} | - |
style | string | Color theme: osm, satellite, carto, carto-dark, topo | osm |
Example Prompts
“Create an editable PowerPoint map highlighting our market presence in Asia”
“Generate a PPTX with European countries color-coded by revenue region”