Charts
Portfolio charts, bar charts, pie charts, and more
Portfolio Charts
generate_portfolio_chartGenerate financial portfolio line charts with smooth curves, gradient fills, and professional styling. Supports light and dark themes, currency formatting, custom colors, annotations, and titles/subtitles. Perfect for investment reports, financial dashboards, and performance tracking.
Preview
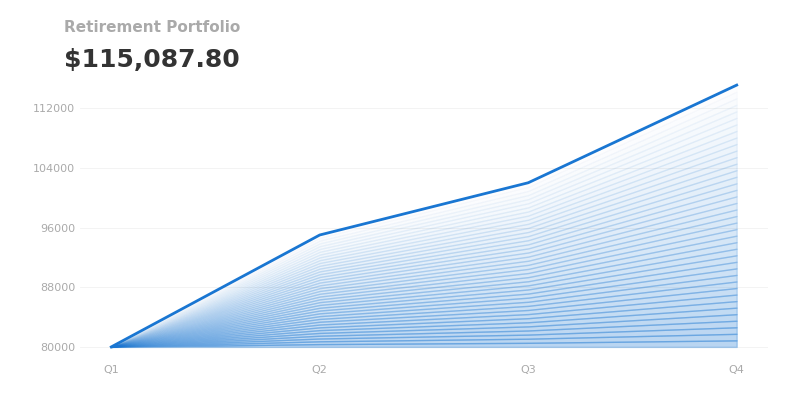 Titled chart - light theme
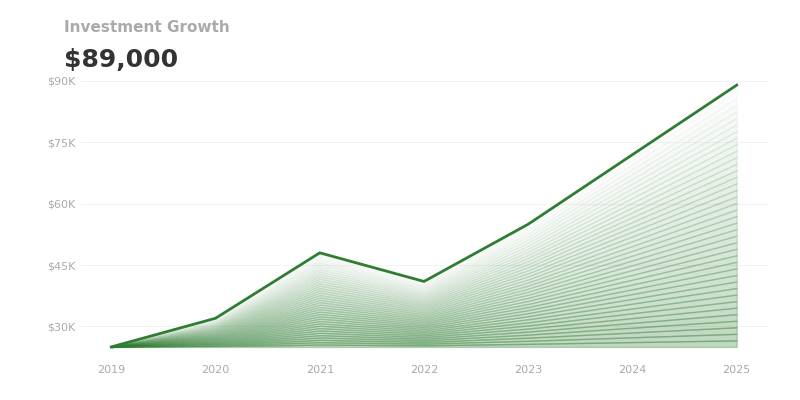 USD currency formatting
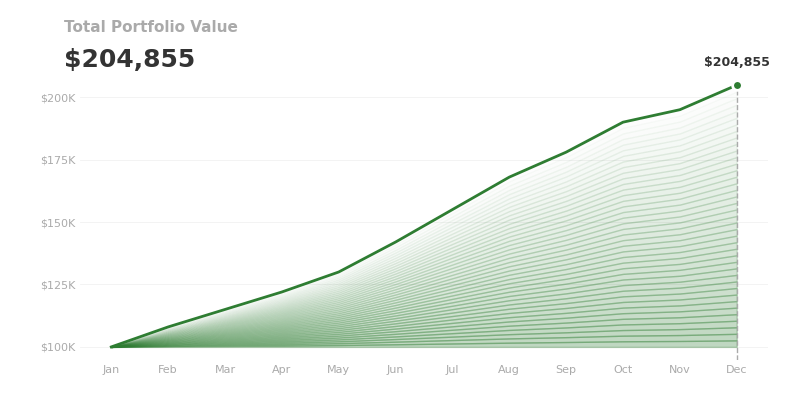 With text annotation
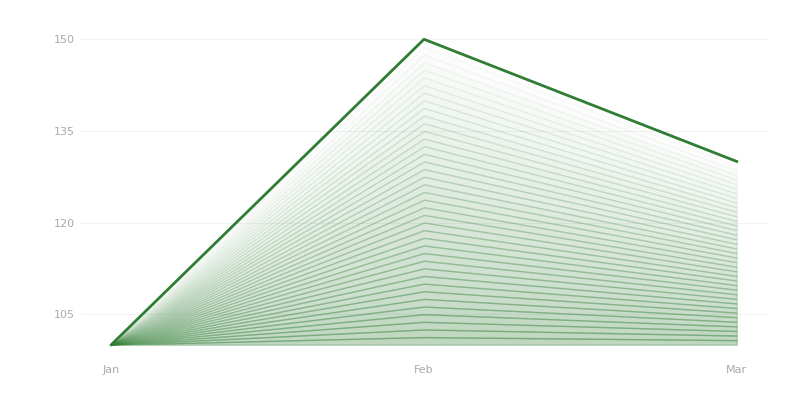
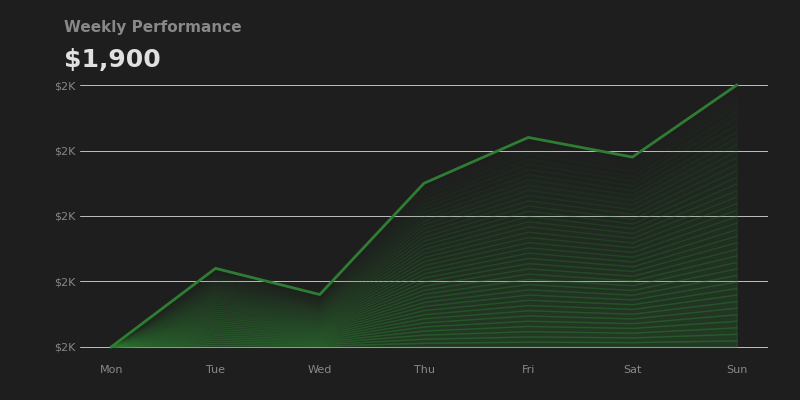 Dark theme - green
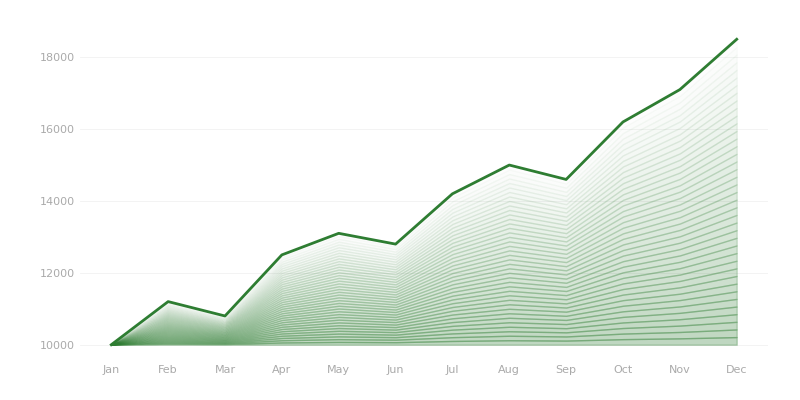 Positive growth trend
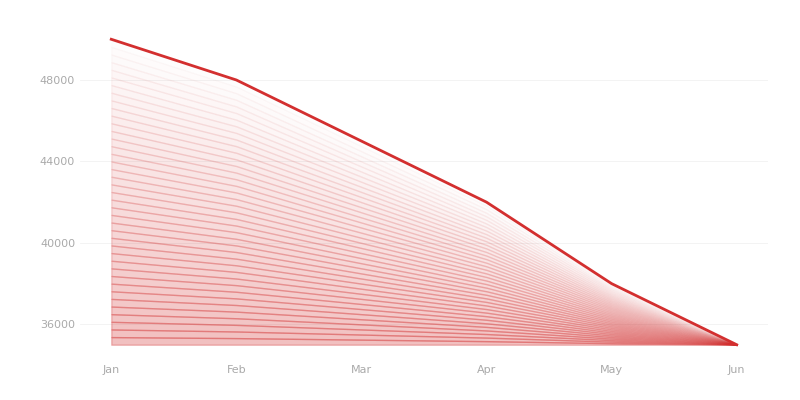 Decline trend - red
Parameters
| Name | Type | Description | Default |
|---|---|---|---|
labelsrequired | array | X-axis labels (dates/periods) | - |
valuesrequired | array | Y-axis values (numbers) | - |
color | string | Line/fill color in hex | #2196F3 |
title | string | Chart title | - |
subtitle | string | Chart subtitle | - |
currency | string | Currency symbol for Y-axis | $ |
annotation | string | Text annotation on the chart | - |
width | integer | Image width in pixels | 800 |
height | integer | Image height in pixels | 400 |
theme | string | Theme: light or dark | light |
Example Prompts
“Create a portfolio chart showing monthly returns for 2024 in blue”
“Generate a dark-themed investment performance chart with USD formatting”
“Show my portfolio growth from $10,000 to $15,000 over 12 months with an annotation at the peak”
Portfolio Charts (PowerPoint)
generate_portfolio_chart_pptxGenerate editable PowerPoint slides with portfolio charts rendered as native shapes. The chart line, gradient fill, axes, and labels are all individual PowerPoint objects. Modify colors, fonts, or data directly in PowerPoint.
All chart elements are native PowerPoint shapes, allowing full customization without leaving PowerPoint.
Preview
 Editable chart in PPTXWith annotation overlay
Parameters
| Name | Type | Description | Default |
|---|---|---|---|
labelsrequired | array | X-axis labels (dates/periods) | - |
valuesrequired | array | Y-axis values (numbers) | - |
color | string | Line/fill color in hex | #2196F3 |
title | string | Chart title | - |
subtitle | string | Chart subtitle | - |
currency | string | Currency symbol | $ |
annotation | string | Text annotation | - |
theme | string | Theme: light or dark | light |
Example Prompts
“Create a PowerPoint chart showing Q1-Q4 revenue growth”
“Generate an editable portfolio chart PPTX for the board presentation”
Charts (General)
generate_chartGenerate a wide variety of charts and graphs using Chart.js. Supports bar, line, pie, doughnut, radar, scatter, bubble, and polar area chart types. Full customization of colors, labels, legends, axes, and data series.
Parameters
| Name | Type | Description | Default |
|---|---|---|---|
typerequired | string | Chart type: bar, line, pie, doughnut, radar, scatter, bubble, polarArea | - |
datarequired | object | Chart.js data object with labels and datasets | - |
options | object | Chart.js options (axes, legend, title, etc.) | - |
width | integer | Image width in pixels | 800 |
height | integer | Image height in pixels | 600 |
Example Prompts
“Create a bar chart comparing revenue by region for Q1-Q4”
“Generate a pie chart showing market share breakdown”
“Make a line chart tracking user growth over 12 months with a trend line”