Examples Gallery
Real output from Mediagram tools — maps, charts, animations, and more
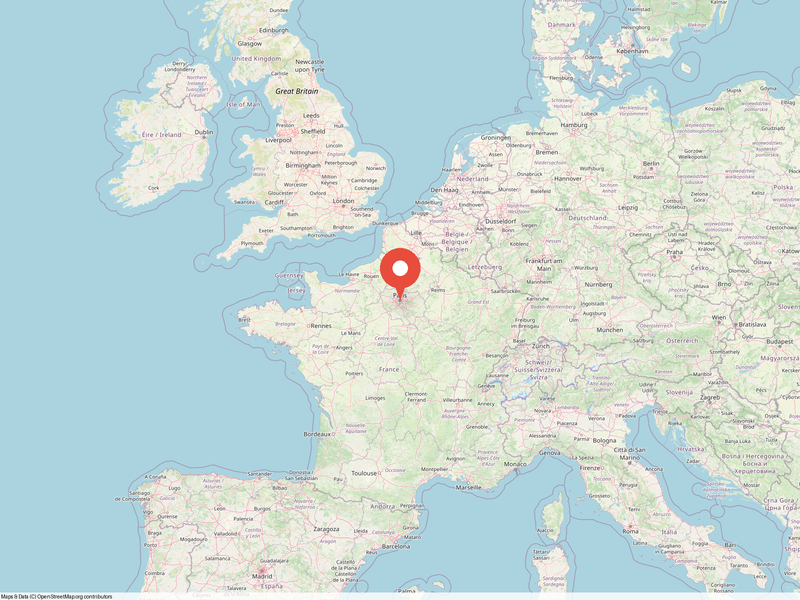
Paris POI Map
Map of Paris with point-of-interest markers at major landmarks. OpenStreetMap tile style.
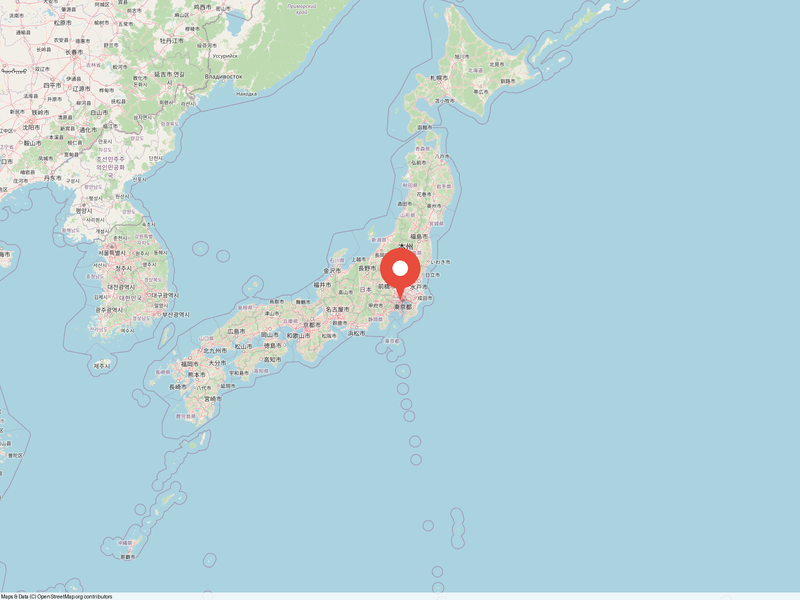
Tokyo City Map
Tokyo city map with custom markers at key locations. Demonstrates multi-marker support.
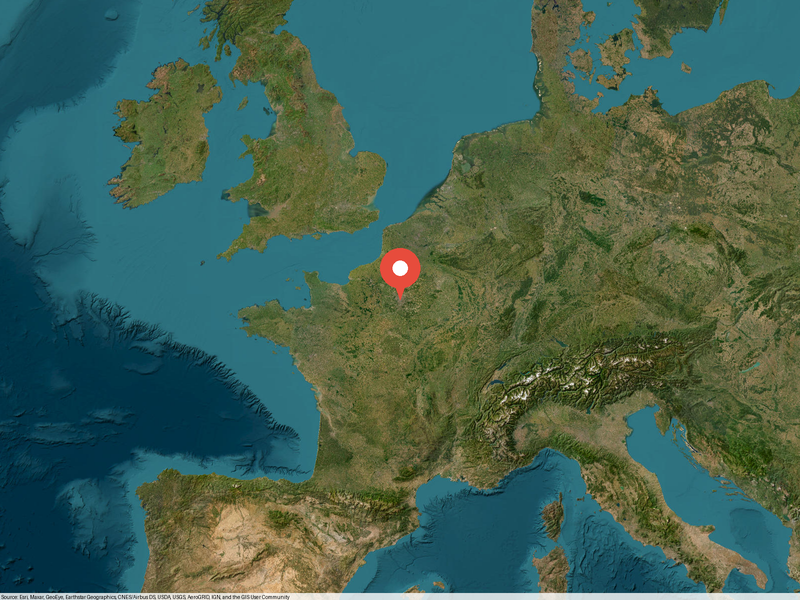
Satellite View
Map rendered with satellite imagery tiles from ESRI. Great for geographic context.
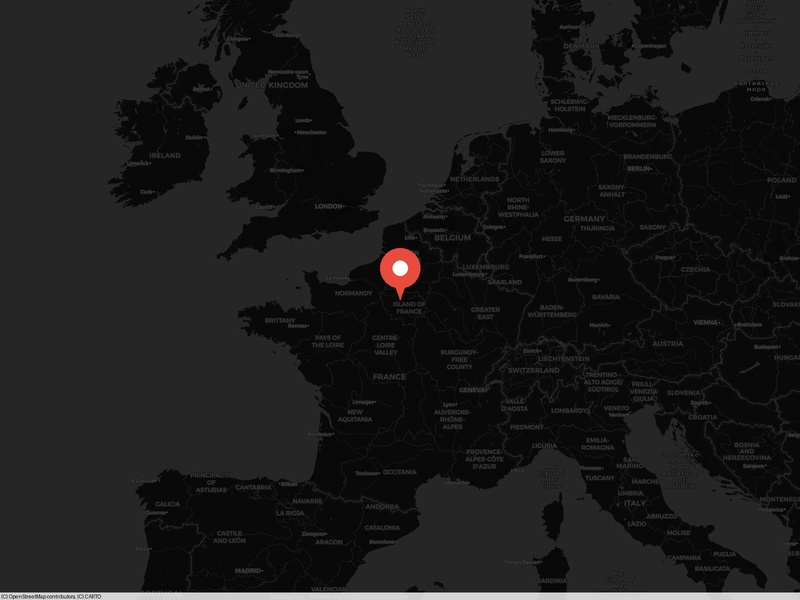
Dark Map Style
Carto dark style map, ideal for presentations and dashboards with dark backgrounds.
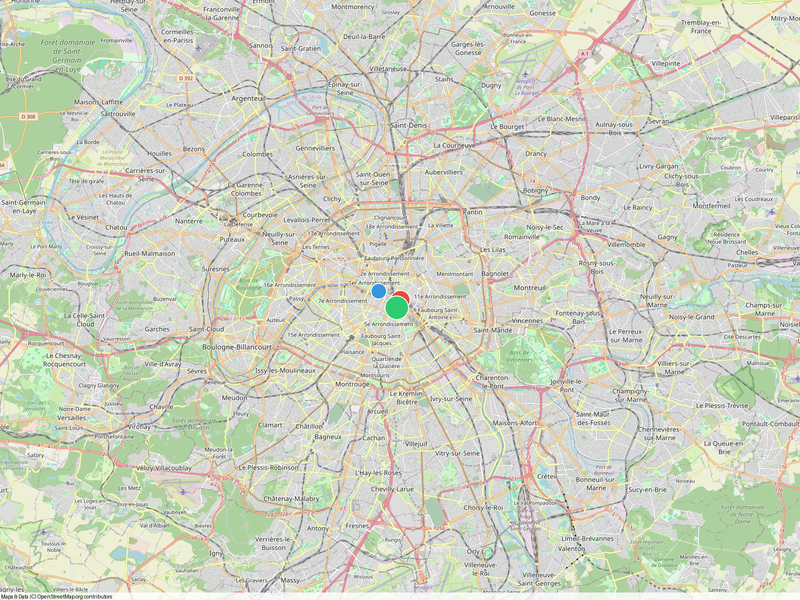
Map Points - Paris
Round colored dots plotted on a Paris map. Anti-aliased rendering with 2x supersampling.
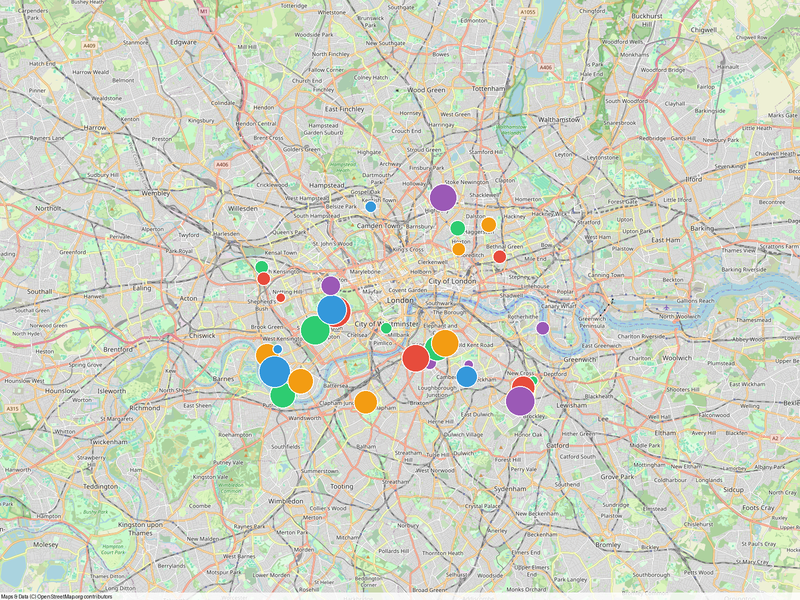
Multi-Point London
Multiple data points distributed across London. Shows clustering and density patterns.
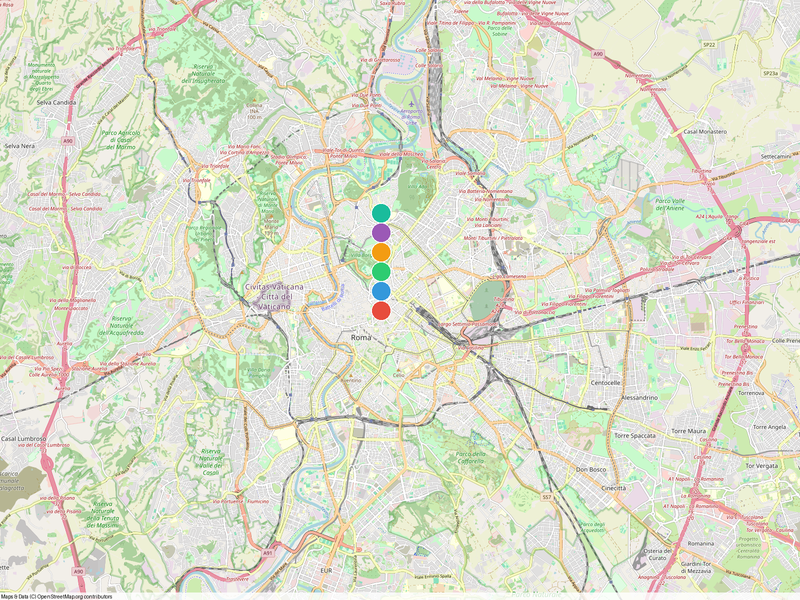
Colored Points - Rome
Multiple point colors on a single map. Each dot can have its own hex color.
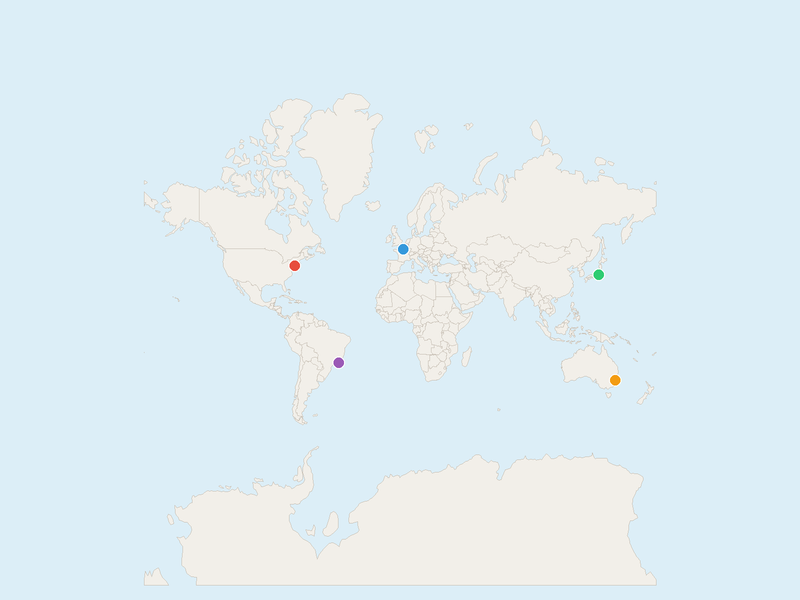
Vector World Map
Offline vector map with dots. Uses Natural Earth data — no network required. Fast rendering.
EU Countries Highlighted
European Union member states highlighted in blue. Countries specified by ISO alpha-2 codes.
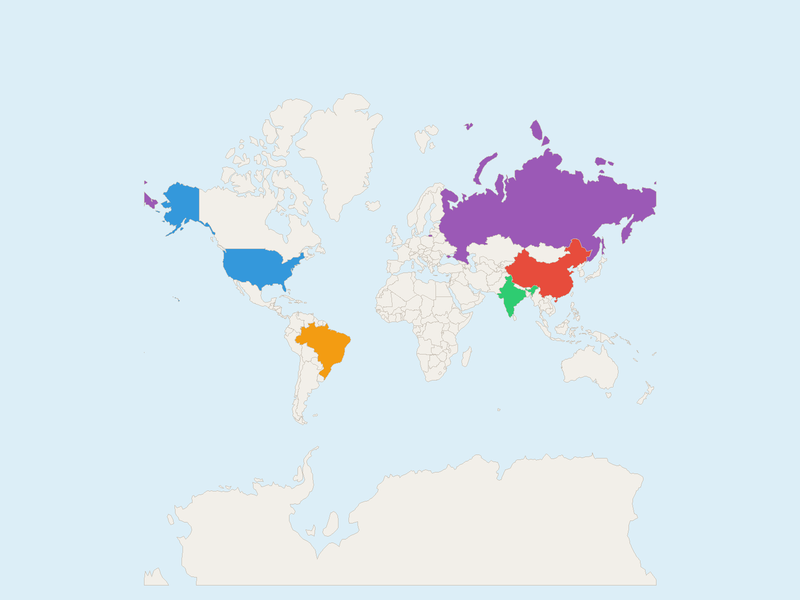
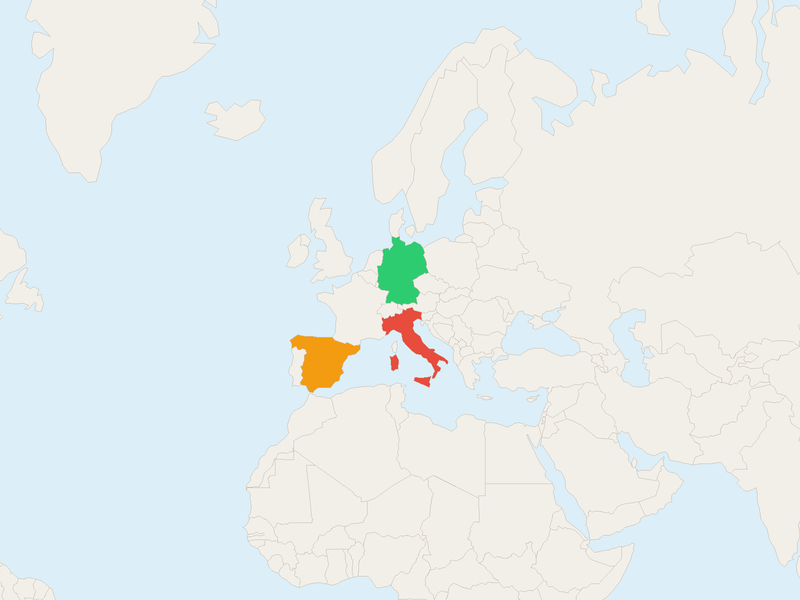
BRICS Nations
BRICS member countries each highlighted in a different color on a world map.
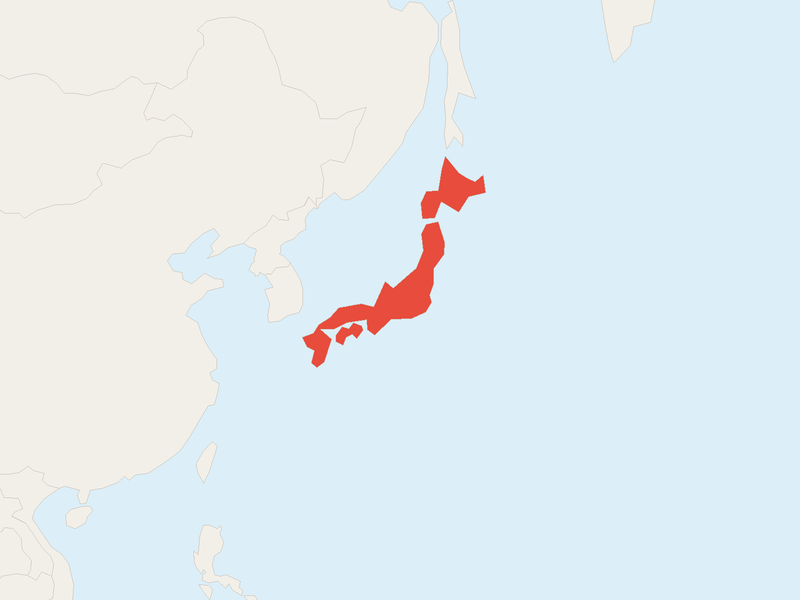
Single Country - Japan
Single country highlighted on the map. Works with ISO codes or full country names.
Paris Zoom - GIF
Smooth zoom animation from world view into Paris. GIF format with OSM tile style. Ready for X/Twitter and Facebook.
Tokyo Zoom - Satellite
Map zoom into Tokyo using satellite imagery. Shows smooth fractional zoom interpolation.
Tokyo Zoom - Dark
Carto dark style zoom animation into Tokyo. Perfect for dark-themed presentations.
London - Green Marker
Zoom animation into London with a custom green marker at the target location.
Instagram Square
Map zoom animation in 1080x1080 square format. Pixel-perfect for Instagram posts and carousels.
Paris Smooth MP4
High-quality 30fps MP4 animation zooming into Paris. Smooth fractional zoom transitions.
London Dark MP4
Smooth 30fps dark-themed zoom into London. X/Twitter-optimized format (1200x675, 16:9).
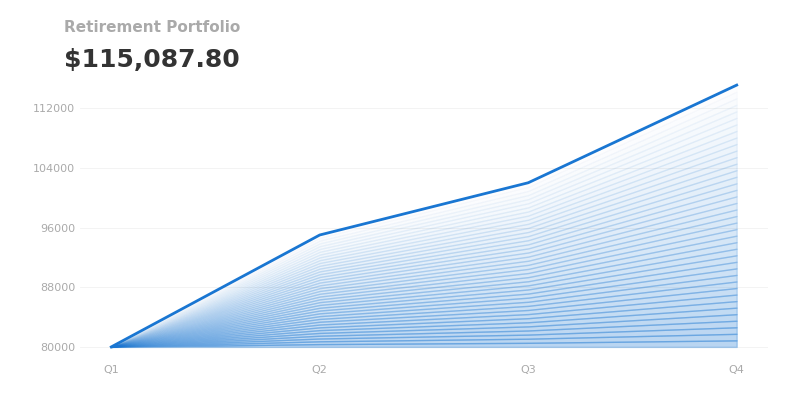
Portfolio Chart - Titled
Financial line chart with title and subtitle. Smooth curves with gradient fill below the line.
Annotated Chart
Chart with a text annotation overlay. Mark important events or milestones on the chart.
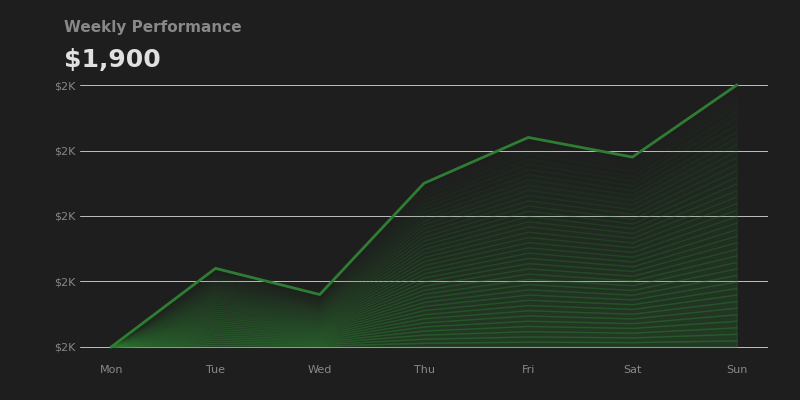
Dark Theme - Green
Portfolio chart in dark theme with green color. Perfect for dashboards with dark backgrounds.
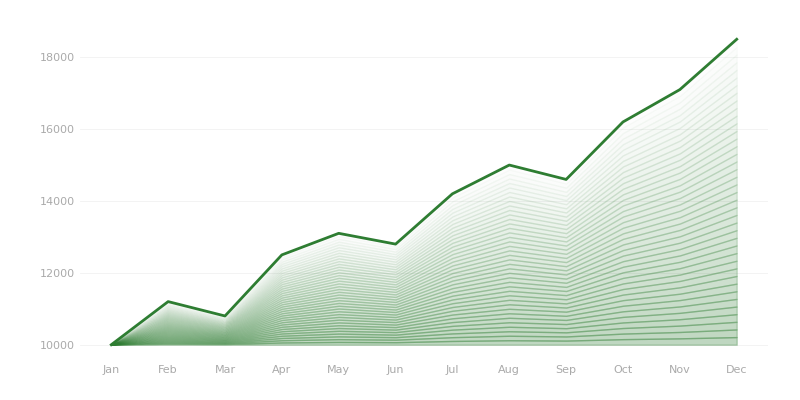
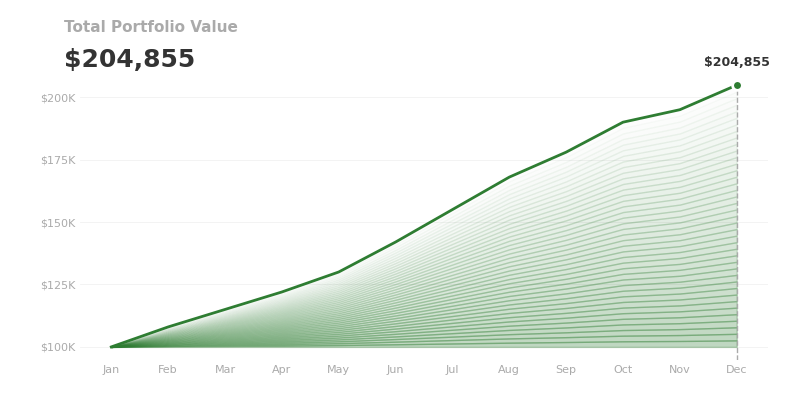
Positive Growth
Upward trend chart in green showing positive portfolio growth over time.
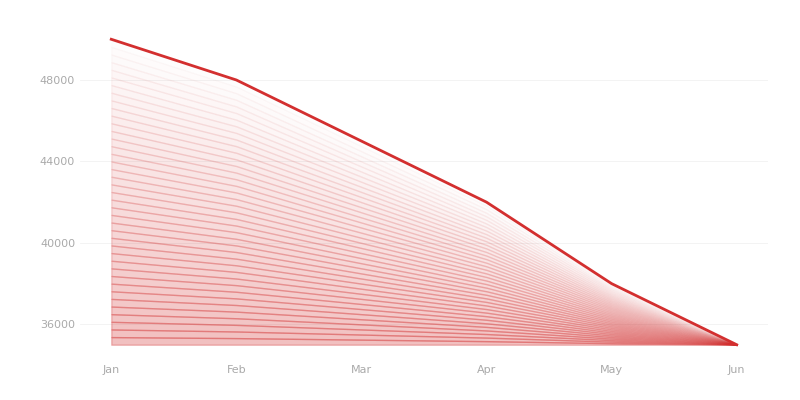
Decline Trend
Downward trend chart in red showing portfolio decline. Useful for risk analysis.
Ready to Create Your Own?
All examples above are real output generated by Mediagram. Every tool supports TikTok, Instagram, X/Twitter, Facebook, and YouTube presets out of the box.